Sample of our 2025-26 NCAAB betting picks

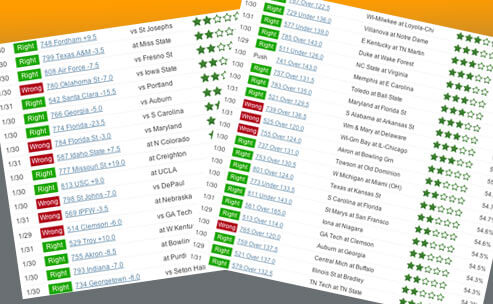
Our premium NCAAB predictions and picks are driven by computer models that analyze millions of data points.

We use a variety of statistical techniques to predict games, including decision trees, similarity scores, and power ratings.

We publish a game winner, point spread, over/under and money line value pick for all NCAAB games, plus win odds for each pick.

Finally, we provide full transparency with our prediction accuracy reports, which track our historical pick performance.

If you're curious how our models work or you have questions about the data below, you can learn more.

Day Status TR Pick Opp/Game Confidence Odds Similar Games Decision Tree Power Rating
2/8 Right 844 Penn St +3.0 vs USC 52.0% PSU 55.0% PSU 52.4% USC +2.3
2/8 Right 842 S Florida -5.0 vs Tulsa 53.5% TLSA 52.0% USF 54.2% TLSA +3.9
2/8 Wrong 848 Ohio St +9.5 vs Michigan 54.3% MICH 51.5% OSU 55.1% OSU +1.8
2/8 Right 845 Texas Tech -4.0 at West Virginia 50.6% WVU 53.5% TTU 50.8% WVU +0.4
2/8 Right 849 NC Greensboro +10.5 at Furman 52.3% FUR 51.8% UNCG 52.7% UNCG +2.2
2/8 Right 856 Memphis -9.5 vs Charlotte 50.1% CHAR 56.5% MEM 50.1% CHAR +4.6
2/8 Wrong 857 UCF +4.5 at Cincinnati 50.4% CIN 57.3% UCF 50.5% UCF +6.3
2/8 Right 853 Maryland +10.0 at Minnesota 51.5% MINN 52.9% MD 51.8% MD +2.8
2/8 Wrong 852 Tulane +5.0 vs Wichita St 50.1% WICH 69.6% TULN 50.1% TULN +1.6
2/8 Right 859 Rice +9.5 at UAB 50.9% RICE 63.7% RICE 51.1% RICE +3.6
2/8 Wrong 862 Iowa -11.0 vs Northwestern 51.7% NW 61.2% IOWA 52.1% NW +1.2